
My routine work includes frequent interaction with Azure Synapse Analytics. A lot of our Power BI Reports and internal data ETLs are based in Synapse Analytics. Recently, Power BI refreshes and ETLs started failing with an error that “SQL Serverless budget limit for a period is exceeded”.
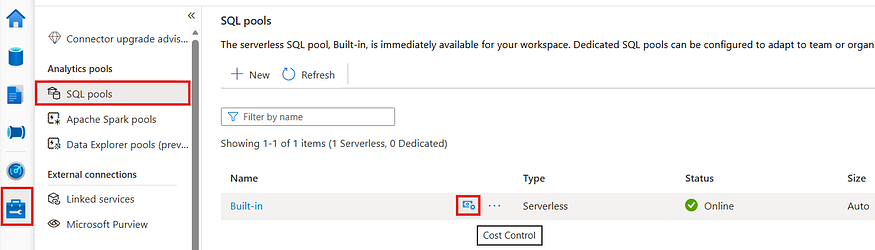
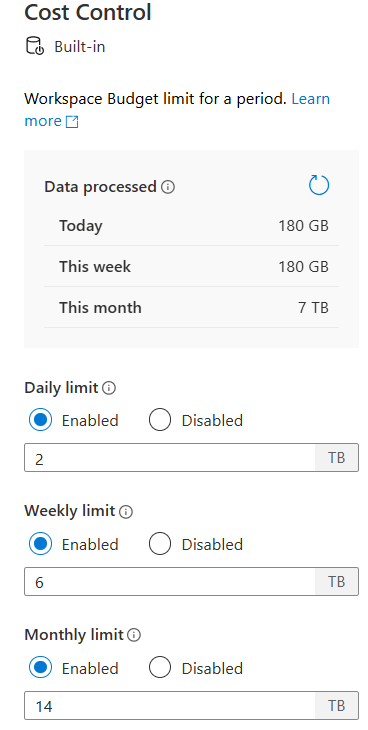
The budget limits for SQL Serverless can be adjusted from the management tab. You can set Daily, Weekly and Monthly limits and also view the data processed till date for the current periods. The limits can also be disabled for various periods.
To investigate why we were running out of budget, I had to check SQL queries that were run in the current week and try to locate the ones that were costing too much.
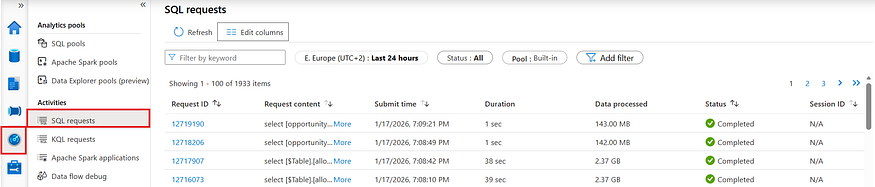
There is a built-in view in Azure Synapse Analytics which can be used to see recent SQL requests with various attributes. This can be accessed from Monitor tab and in Activities pane from the SQL requests tab. I was able to locate costly queries, however, the built-in view does not provide sorting on Data processed and Duration column, hence you have to manually scroll through to find out the queries.
I wanted to have more control on filtering and sorting the SQL requests history. To do that, there are two options.
- Using Azure Log Analytics Workspace
- Using SQL Server Management Studio
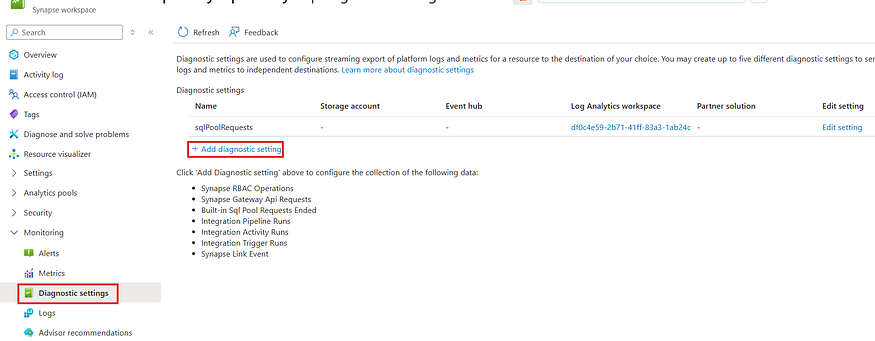
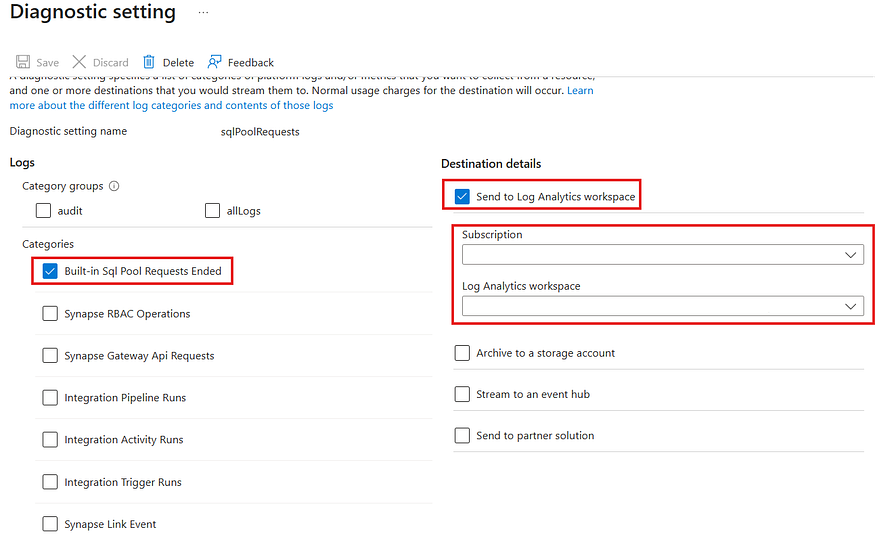
To use Azure Log Analytics Workspace, if not already configured, you have to first configure diagnostic settings for the Azure Synapse Analytics workspace. The configuration can be accessed from Monitoring section and then choosing Diagnostic settings. You have to choose Built-in Sql Pool Requests Ended and Send to Log Analytics workspace as destination.
Following screenshots show how this can be done.
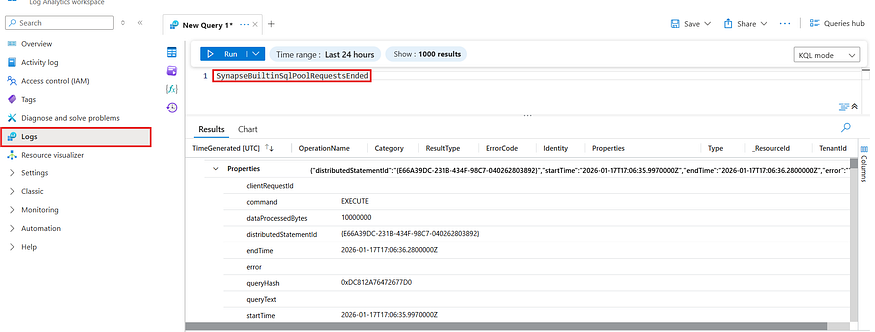
Once the configuration has been added, you have to wait for some time for the diagnostics to start coming in. Then from the connected Log Analytics Workspace you can query the table SynapseBuiltinSqlPoolRequestsEnded with KQL queries.
A sample column is shown in the following screenshot with the columns available. The Properties column has a lot of information, including the query used as well as dataProcessedBytes.
Following KQL query can be used to show all the queries that processed more than 1GB of data in the last 7 days.
SynapseBuiltinSqlPoolRequestsEnded
| where TimeGenerated > ago(7d)
| extend DataProcessedGB = toreal(Properties.dataProcessedBytes) / (1024*1024*1024)
| where DataProcessedGB > 1  // Queries processing more than 1GB
| project
    TimeGenerated,
    Identity,
    DataProcessedGB,
    Command = tostring(Properties.command),
    QueryText = tostring(Properties.queryText)
| order by DataProcessedGB desc
If you use SQL Server Management Studio, you can access the Dynamic Management View sys.dm_exec_requests_history to query SQL history and filter the way you want using SQL queries.
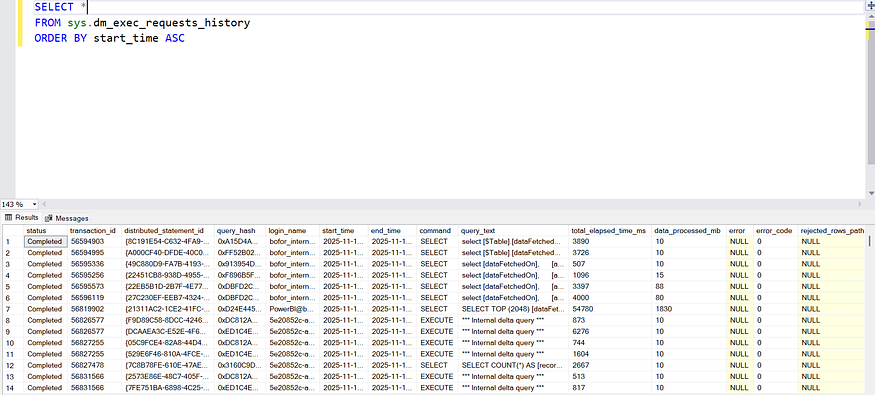
Following SQL query can be used to show all the queries that processed more than 1GB of data in the last 7 days.
SELECT
    start_time AS TimeGenerated,
    login_name AS [Identity],
    data_processed_mb / 1024.0 AS DataProcessedGB,
    total_elapsed_time_ms AS DurationMs,
    command AS Command,
    CAST(query_text AS NVARCHAR(MAX)) AS QueryText,
    status,
    error
FROM sys.dm_exec_requests_history
WHERE start_time > DATEADD(day, -7, GETDATE())
    AND data_processed_mb > 1024  -- More than 1GB (1024 MB)
ORDER BY data_processed_mb DESC