
In today's digital age, monitoring and optimizing application performance is crucial for maintaining stability, governance, and user satisfaction. Power Platform telemetry provides a powerful tool for tracking how Dataverse applications perform and are used. By subscribing to Application Insights, organizations can diagnose and troubleshoot issues related to errors and performance, ultimately improving application stability and performance.
In this blog, I will split the content into two parts:
In the first part, I will provide an overview of Application Insights, its data model in the context of Dataverse telemetry, and how queries can be performed. Additionally, I will explain how to log activities in Application Insights.
In the second part, I will demonstrate how to log user/application activities from various Power Platform components, including Model-driven Apps, Canvas Apps, Power Pages, Power Automate, and Plugins. I will also show how to display this data in a custom dashboard within Application Insights. Furthermore, I will explain how alerts can be triggered and sent to different systems, allowing for the detection of issues even before users are aware of them.
Overview of Application Insights

Application Insights is an extension of Azure Monitor, designed to monitor applications from various environments. It offers several key features that are essential for effective application performance management.
Application Performance Management (APM):
- Application Dashboard: Provides a comprehensive view of your application's health and performance.
- Application Map: Visualizes the architecture and interactions of application components.
- Live Metrics: Offers real-time analytics on application activity and performance.
Diagnostics and Troubleshooting:
- Transaction Search: Helps trace and diagnose transactions to identify issues and optimize performance.
- Failures View: Identifies and analyzes failures to minimize downtime.
- Performance View: Reviews performance metrics and potential bottlenecks.
Monitoring and Alerts:
- Alerts: Monitors various aspects of your application and triggers actions based on predefined conditions.
- Metrics: Provides deep insights into usage patterns and trends.
- Diagnostic Settings: Configures the export of platform logs and metrics to your chosen destination.
Usage Analysis:
- Users, Sessions, and Events: Tracks and analyzes user interactions, session trends, and specific events.
- Funnels: Understands user progression through application steps and identifies drop-off points.
- User Flows: Visualizes user paths to pinpoint high engagement areas and potential issues.
Code Analysis:
Profiler: Captures and views performance traces for your application.
Integrating Power Platform with Application Insights
Power Platform offers out-of-the-box Application Insight integration with Dataverse environments. Each Dataverse environment requires its own AI resource, as a single AI environment cannot contain data from multiple environments. Here are the steps to set up the integration:
- Create Application Insight: Create application insight in Azure portal with a meaningful name.
- Configure Data Export: In Power Platform Admin center, navigate to Data Export and create a new data export.
- Data Package: Provide a name for the export package and select the available options based on your needs.
- Environment: Select the Dataverse environment whose data are being exported.
- Subscription: Provide Azure subscription, resource group, and Application Insight resource where the Application Insight was created in step 1.

Telemetry Data Model
The Application Insight integration with Dataverse populates standard Application Insight tables and columns.
Currently, page views, outbound network calls, incoming API calls, plugin executions, SDK executions, and exceptions are all included in the native Dataverse telemetry integration.
In the table below, you can see where different types of Dataverse telemetry are recorded.
| Telemetry Type (Dataverse) | Application Insight table Name |
| UI Page Load | PageView |
| Dataverse API incoming call | Request |
| UI outbound network request | Dependency |
| SDK Execution (CRUD operation) | Dependency |
| Plugin Execution | Dependency |
| Exception during Plugin and SDK execution | Exception |
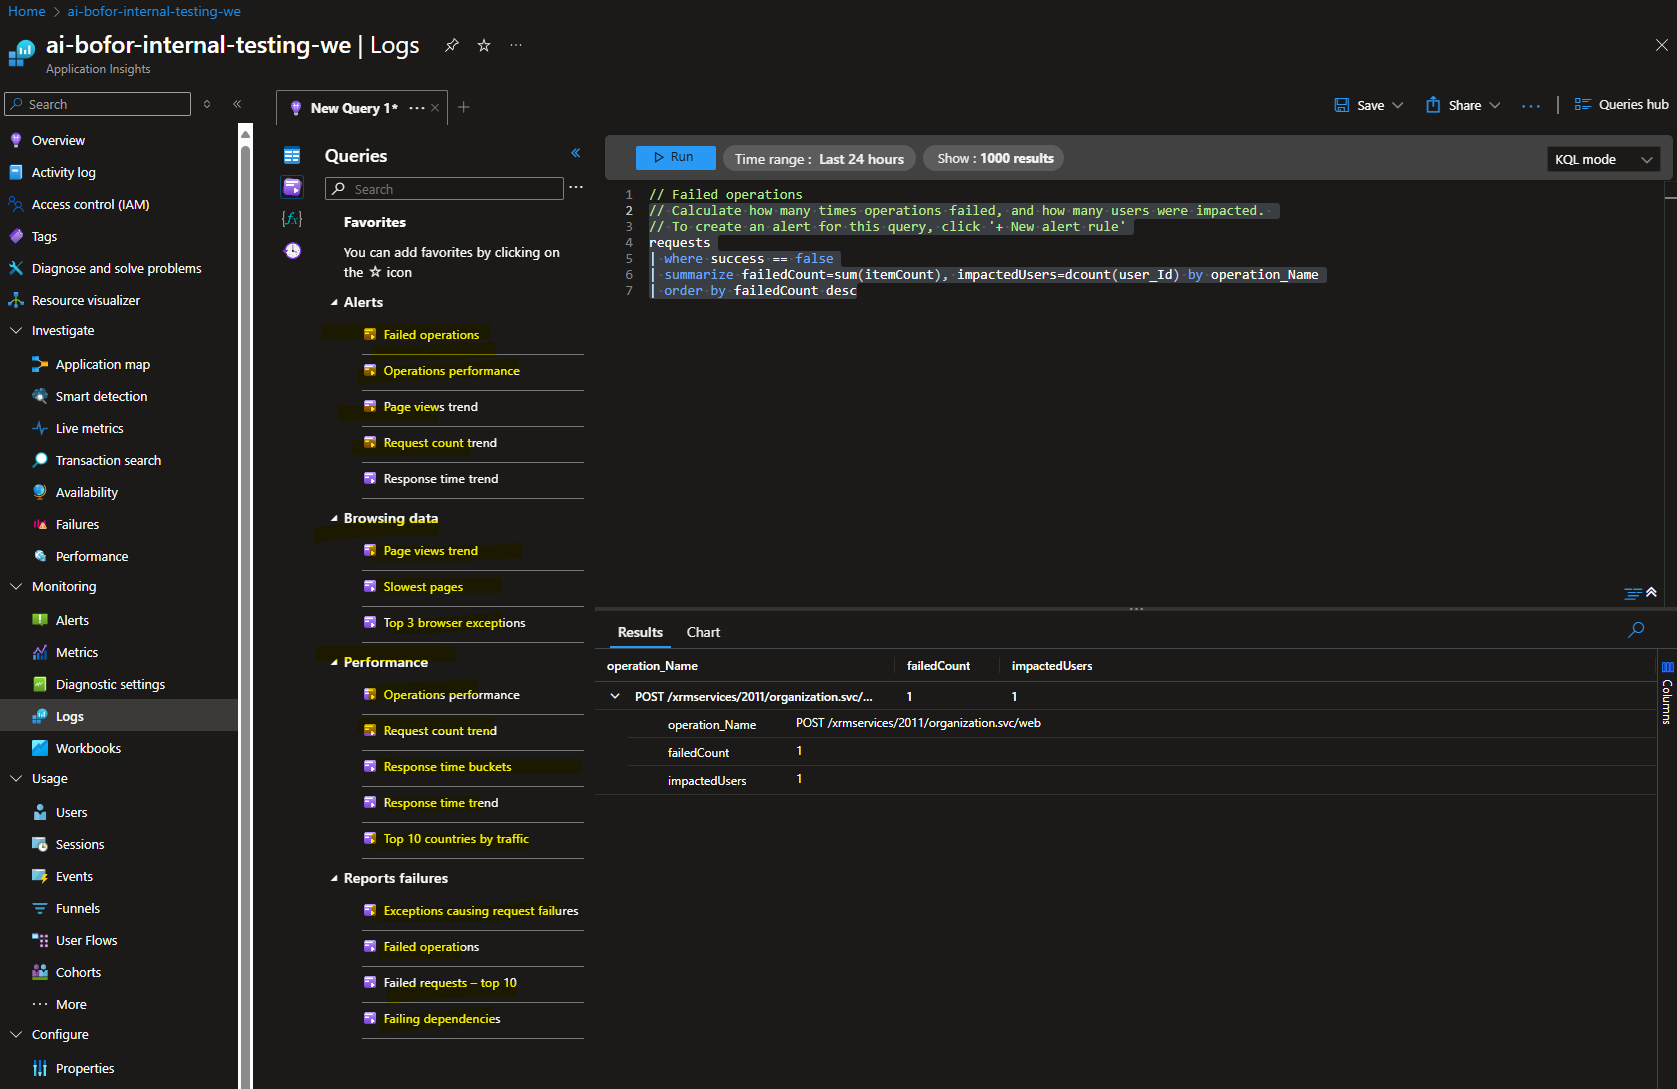
Queries, Logs And Investigation
Within the log area of Application Insights, tables can be found where queries are typically created. Queries in Application Insights are made using Kusto Query Language (KQL).

There is option to create your own queries, there are many out-of-the-box queries available that serve as a great starting point. These pre-built queries use the standard schema, and although you might need to adjust some columns to make the results more meaningful.
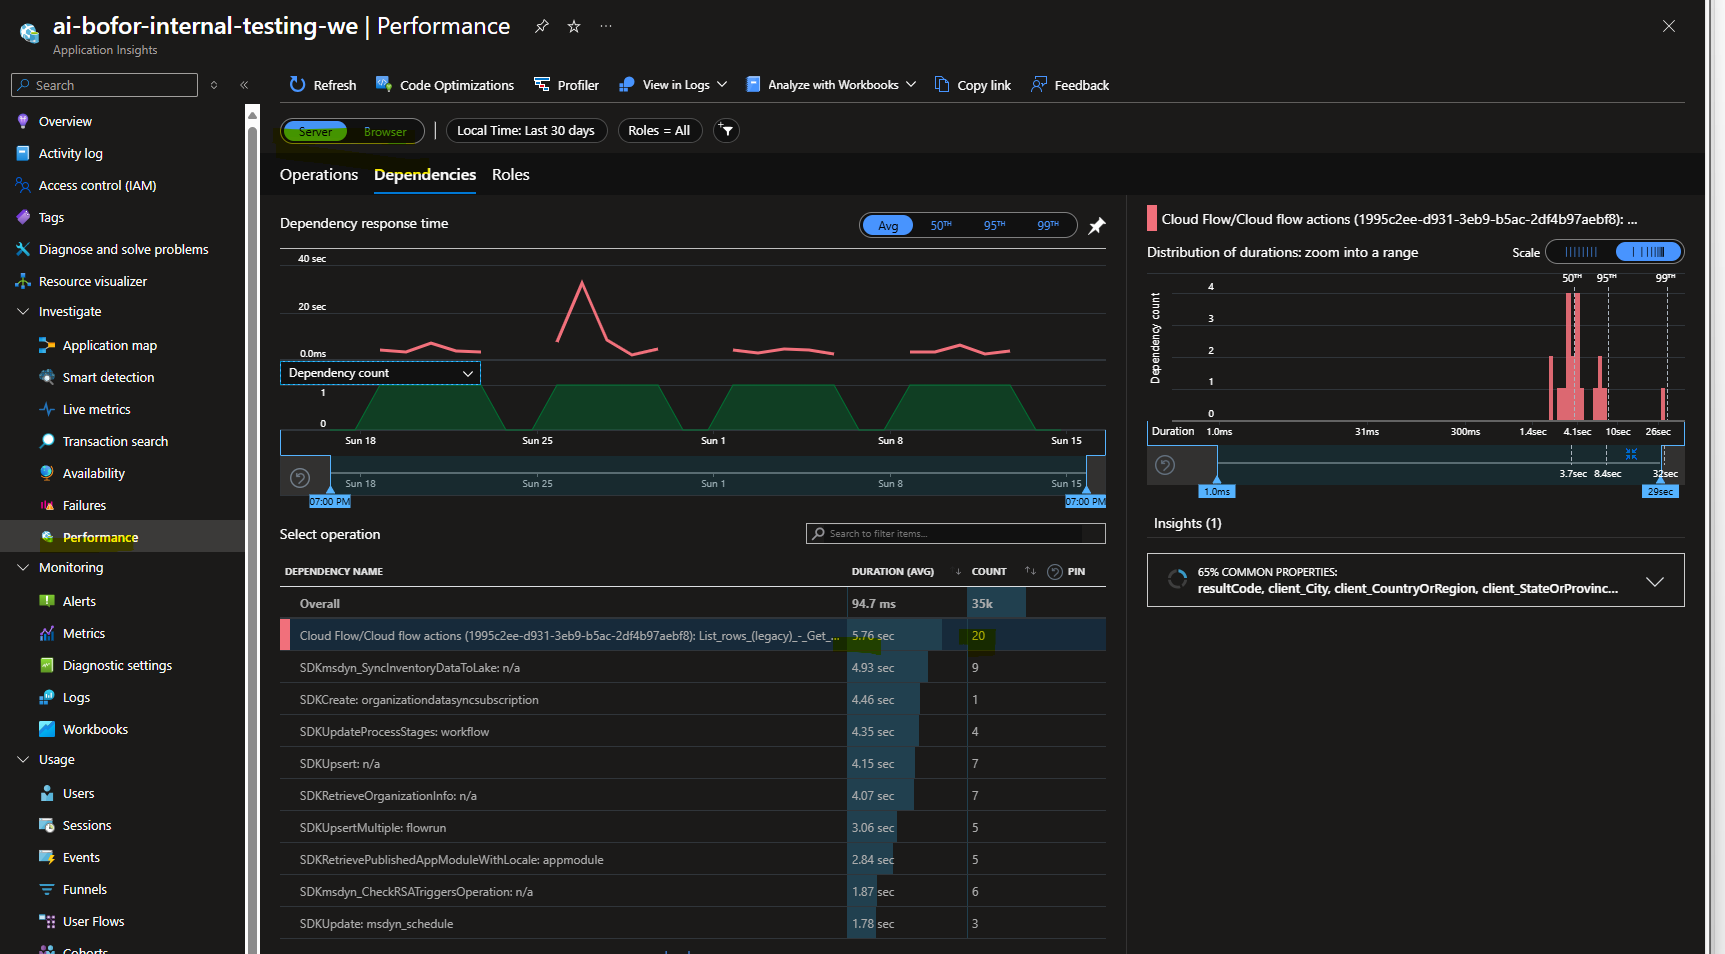
There is an out-of-the-box pane available to investigate Failures or Performance issues. This pane allows for detailed investigations and provides the possibility to filter by server or browser side. For example, you can see Cloudflow with GetOpportunity being called frequently and having high duration on runs.
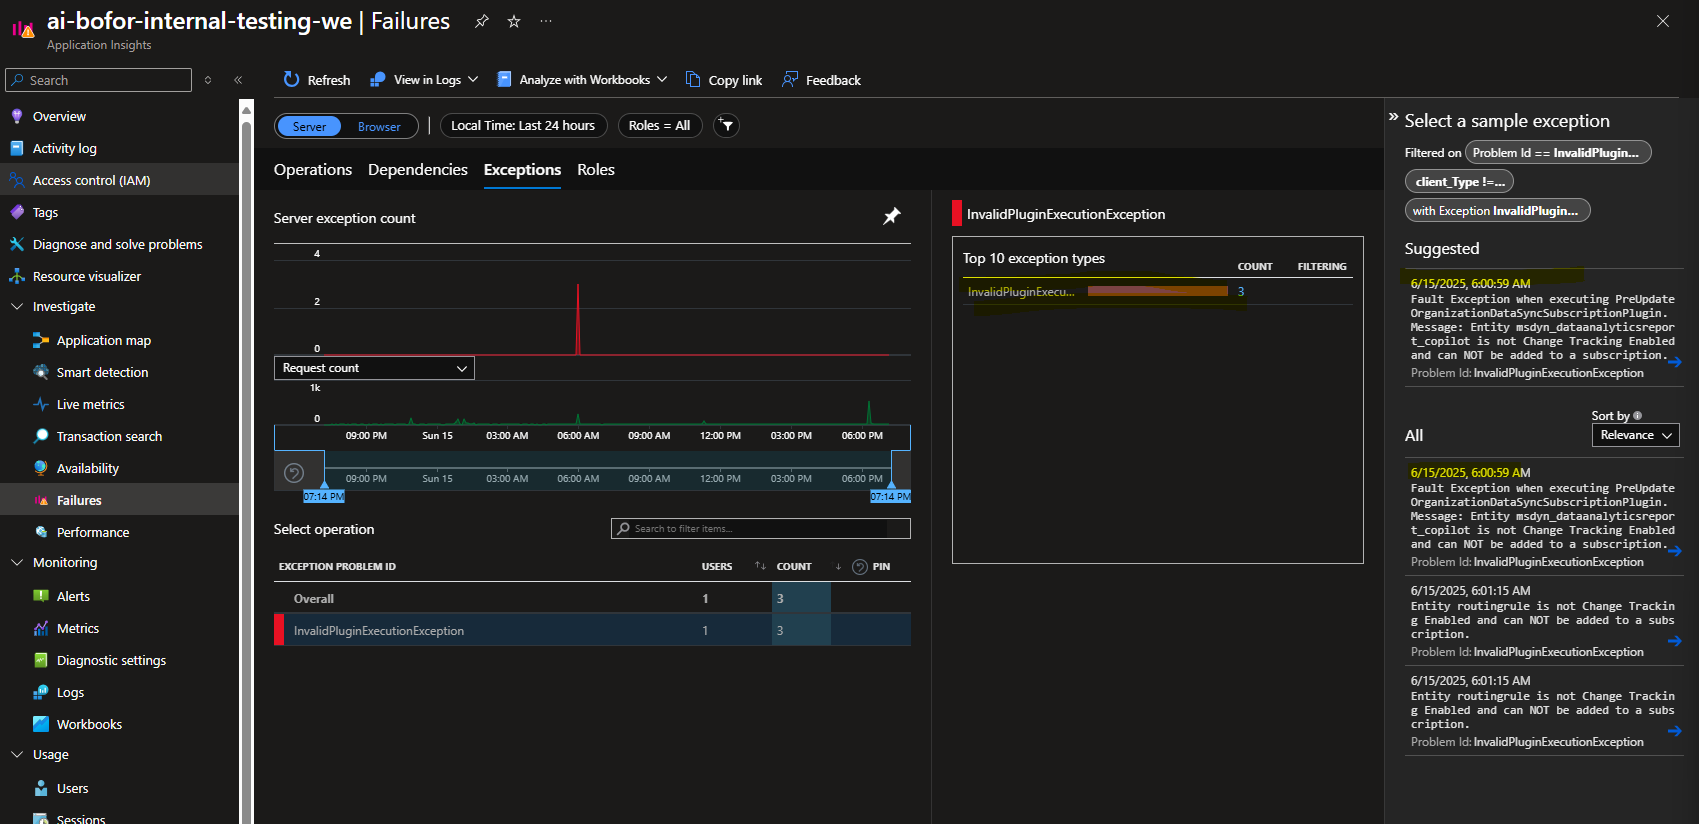
Similarly, in the case of exceptions picture below, you might notice a high number of InvalidPluginExecutionException errors occured. As we drill down into its End-to-End transaction details, we can identify specific issues causing these exceptions.
Conclusion
Understanding Application Insights and its data model in the context of Dataverse telemetry is important for pinpointing where data are located in the Application Insight tables. By performing queries on those table, we can gain valuable insights into application's performance and user behavior in Dataverse.
Now, let's move on to the second part of the blog, where we will explore how to log user activities from various Power Platform components and how to set up alerts to proactively manage potential issues.